Spend analytics is the practice of gathering, cleansing, examining, and interpreting a company’s expenditure data. By compiling all purchasing-related data from across the business, procurement and operational leaders can analyze spending patterns and trends, identify immediate budget-saving opportunities, and gain useful insights into the end-to-end procurement process.
Spend Analytics Benefits
Typical procurement improvements delivered via spend analytics include:
- Uncovering opportunities for strategic sourcing to lower costs and strengthen valuable supplier relationships.
- Ability to negotiate discounts based on volume and supplier performance.
- Improved oversight of supply chain processes to drive compliance.
- A reduction in supplier risk.
- A spend cube that can inform future savings opportunities and budgetary decisions.
- Spend visibility into direct spend, indirect spend, maverick spend, and more across the enterprise.
- Extraction and compilation of data sources into a spend analytics dashboard to visualize procurement costs and provide procurement leaders with tangible insight into expenditures per business unit.
How Does Spend Analytics Support Procurement?
Spend analytics optimizes organizations’ procurement performance by integrating information from sourcing data, cleaning it for accuracy, and categorizing it at an item level. Cost savings are a common goal for this process.
Most organizations are increasing the time spent analyzing the process by using analytics software to understand their spending patterns better, identify future savings opportunities, and increase Source-to-Pay efficiency.
Explore expert Procurement & Cost Transformation solutions that solve real-world problems
Optimize Source-to-Pay, capitalize on procurement analytics, and drive cost management sustainably across the enterprise.
Spend analytics software with reliable data and deep classifications can empower organizations to make better, more actionable decisions. Stakeholders involved with or impacted by advanced spend analytics typically include:
- Business end users and budget owners.
- Operational managers.
- Procurement professionals.
- C-level management.
- Financial Planning and Analysis (FP&A) professionals.
Steps to Successfully Implementing a Spend Analytics Strategy
- Retrieve procurement data.
- Validate completeness and accuracy of data.
- Cleanse data and normalize suppliers.
- Organize data by category into a deep, standardized taxonomy.
- Enrich data with metrics and benchmarks.
- Use an analytics tool to evaluate data and generate instant insights and visibility.
- Identify savings opportunities, process efficiencies, and contract creation or renegotiation options.
Business spend management (BSM) applications like Coupa enforce correct data entry at the time of request, which drives data compliance and standard spend taxonomy throughout the procurement process to Purchase Order and Invoice.

Featured Insight
Modern Spend Analytics Software
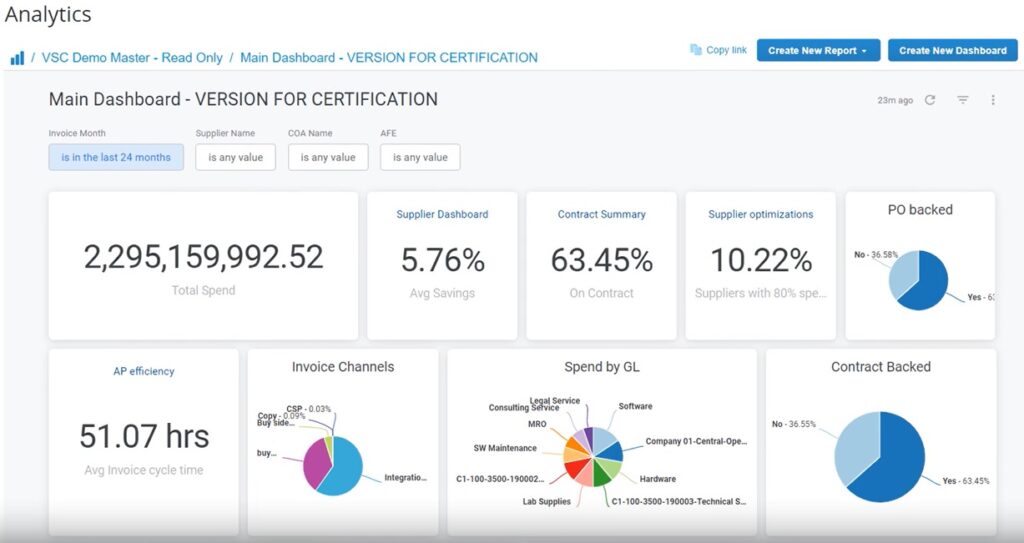
Purchasing patterns are easier to see on dashboards, charts, and tables. Often these are built as static presentations or spreadsheets. When done manually or with outdated tools, data preparation process can take months, limiting the frequency of use.
As opposed to legacy office applications such as PowerPoint or Excel, spend analytics technology provides a variety of dynamic visualizations that allow data exploration through filters and drilldowns, empowering the procurement team (and others) with valuable insight that otherwise can’t be achieved. By using an analytics platform, such as Coupa, data cleansing and categorization time dramatically decreases, while data accuracy increases.
SaaS procurement analytics can also provide spend analysis solutions that automatically identify common cost-saving strategies, such as vendor consolidation, volume discounts, and purchase price variance.
One common way to segment procurement data is by procurement category. Category-specific data allows category managers to use their expertise for cost reduction, supplier consolidation, and contract coverage. Additional ways to demonstrate procurement data include budget segment (Department, Location, Region) or by Supplier.
As companies make the switch, spend analytics is moving from a yearly check to a quarterly or monthly review. As procurement experts, business leaders, and management apply actionable insights, it can become an everyday tool to understand the past and help predict future spending and savings.
For expert spend analytics implementation and supplier management support, contact CrossCountry Consulting.