Data continues to drive innovation and change across enterprises, and Internal Audit functions are no exception. The recent crisis has increased the spotlight on data analysis and visualization, and we are now accustomed to insightful dashboards as a means of informing our own decision making. Internal Audit must follow suit, harnessing the power of data analytics to efficiently deliver greater value and insight for the organization.
Getting Started
- Ensure the team has the right expertise. Every Internal Audit professional should complete training on basic data analysis, and Internal Audit functions should include data analytics as a required component of their training program. A deeper analysis will require support from someone with this specialty.
- Get savvy on data analysis and visualization tools. Common data analytics tools used by Internal Auditors include Alteryx, Galvanize, and SQL. Additionally, R and Python are open source programming languages oriented towards data science that can be leveraged to perform complex data analysis. Tableau, Power BI, and other tools allow you to create meaningful visualizations to enhance audit reporting and drive management decisions. Governance, Risk and Compliance (GRC) tools often include a built-in data analytics or visualization component.
- Plan ahead. Moving to advanced data-driven audit techniques may take additional time and coordination with stakeholders. Whether you are planning to extract a new data set for one audit or build an automated connection that enables continuous monitoring, you should allow additional time to access requisite data and work through the details with management.
- Include consideration of data analytics for every audit. Auditors should integrate data analytics on an “if not, why not?” basis. In fact, in the Institute of Internal Auditors Standards for the Professional Practice of Internal Auditing, section 1220.A2 explicitly mentions the consideration of data analysis: “In exercising due professional care internal auditors must consider the use of technology-based audit and other data analysis techniques.”
Harnessing the Power of Data
Specific data analytics techniques vary based on the organization and audit, but a few common examples are: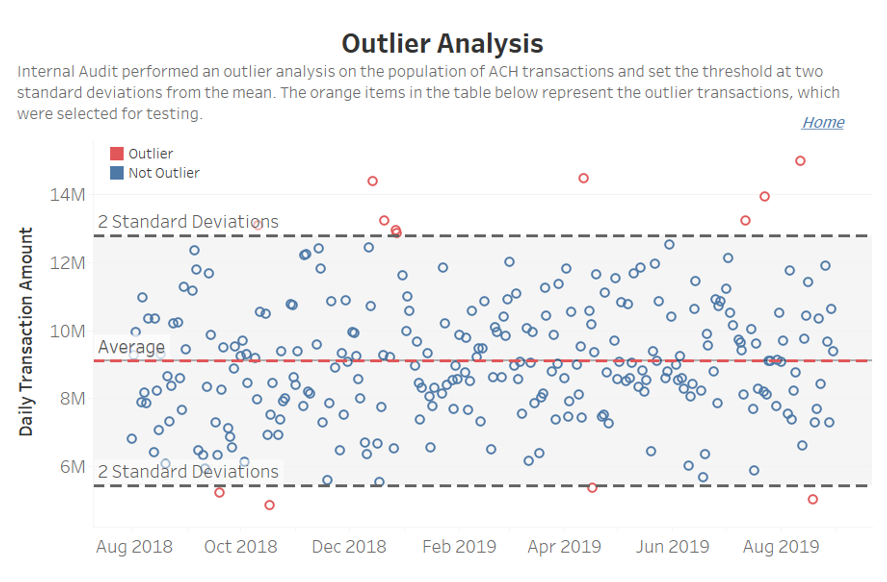
- Identifying Outliers – Data analytics can help to identify patterns and anomalies within datasets that may be indicative of operational inefficiencies, control gaps, or potential fraud (see example to the right).
- Auditing Full Populations – Data analysis techniques make it easy to gain greater audit coverage by auditing entire populations instead of samples. Examples include verifying adherence to approval thresholds, identifying segregation of duties violations, and ensuring all required information is captured for transactions.
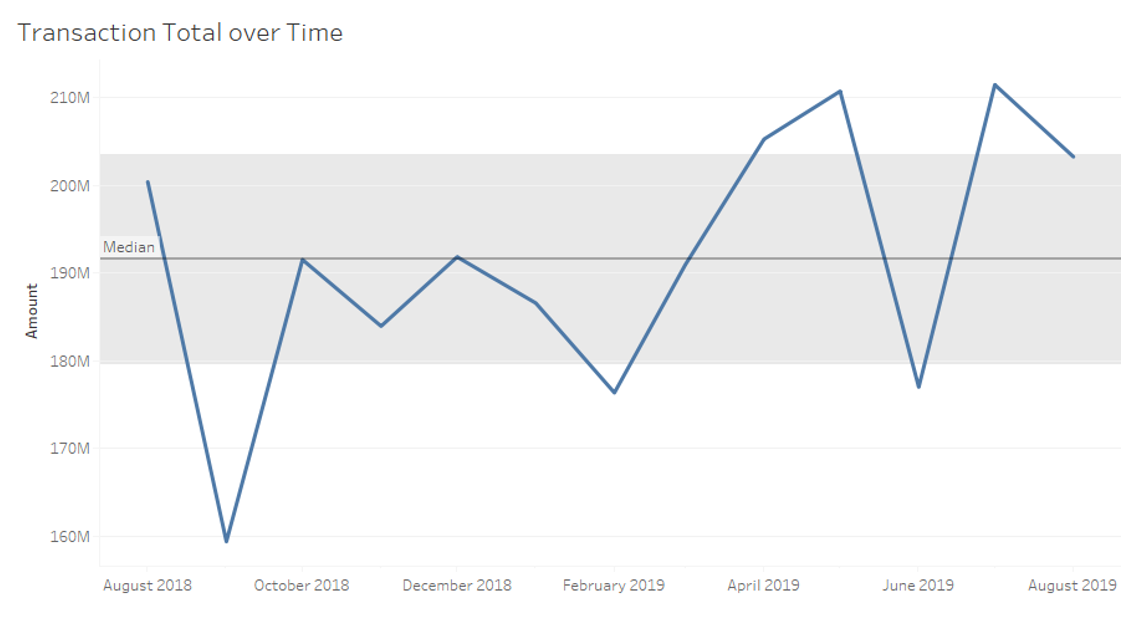
- Trend Analysis – Viewing trends over time can help to identify deviations from rolling averages or management expectations. These could be indicative of a control gap or inefficiency.
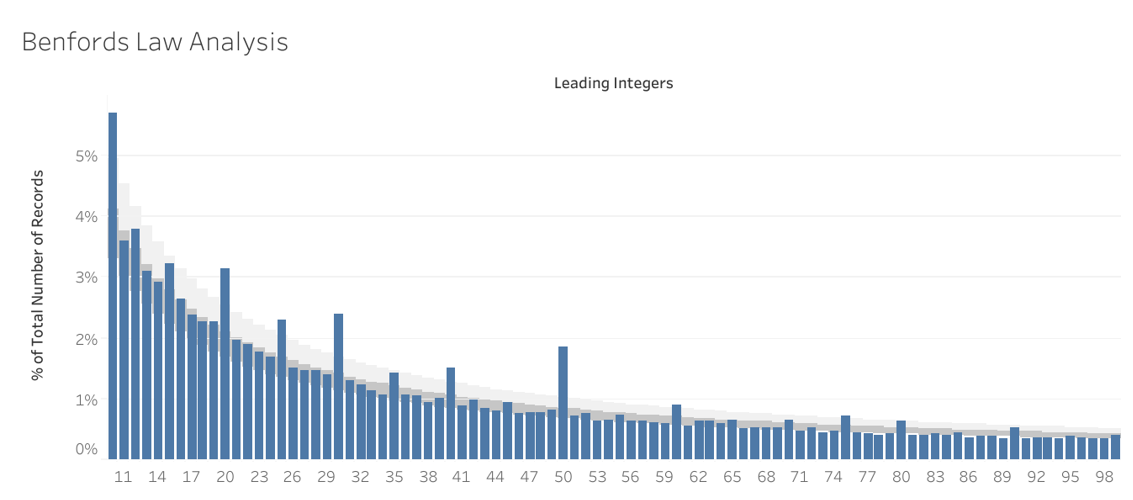
- Benford’s Law – Benford’s Law evaluates the frequency of leading digits against an expected curve based on real-life data sets. It is a powerful tool for detecting potential errors or fraud, and deviations from the expectation should be investigated. For example, Benford’s Law can identify excessive transactions just under an approval threshold, which could indicate fraud.
- Identifying Duplicate Transactions – Data analytics makes it easy to identify potential duplicate transactions. This can be useful when evaluating employee expense, payables, or purchase card data.
- Compliance Monitoring – All organizations are subject to compliance obligations, either regulatory in nature or driven by an organization’s own strategy and internal policies. Data analytics can be leveraged by Internal Audit to monitor compliance with key obligations, as documented by management in a compliance obligations register. Automated reporting underpinned by data analytics procedures enables serious breaches of compliance obligations to be identified in real time, and escalated to key decision makers in a judicious manner.
Leveraging Data Visualization
Data visualization tools allow Internal Auditors to present findings and insights to the Audit Committee and key stakeholders in a meaningful way. Dashboards can be used to present the status of observations and risks. This allows management to prioritize and quickly focus on areas that require attention.
Key Takeaways
Now more than ever, Internal Auditors need to leverage data analytics techniques to enhance their audit coverage, deliver meaningful insights, and improve efficiency:
- Upskill your auditors’ data analysis skills or leverage third-party expertise in order to ensure a data analytics-enabled internal audit methodology can be effectively implemented.
- Understand the data analytics and visualizations tools already in place at your organization and evaluate whether they can be leveraged by Internal Audit.
- Ensure your Internal Audit function’s methodology prioritizes the use of data analytics procedures on an “if not, why not” basis.
- Empower your Internal Audit function to monitor your organization’s compliance with key compliance obligations through data analytics procedures.
- Utilize data visualization to present significant internal audit findings to the Audit Committee and key decision makers in a more impactful manner.